Derivatives
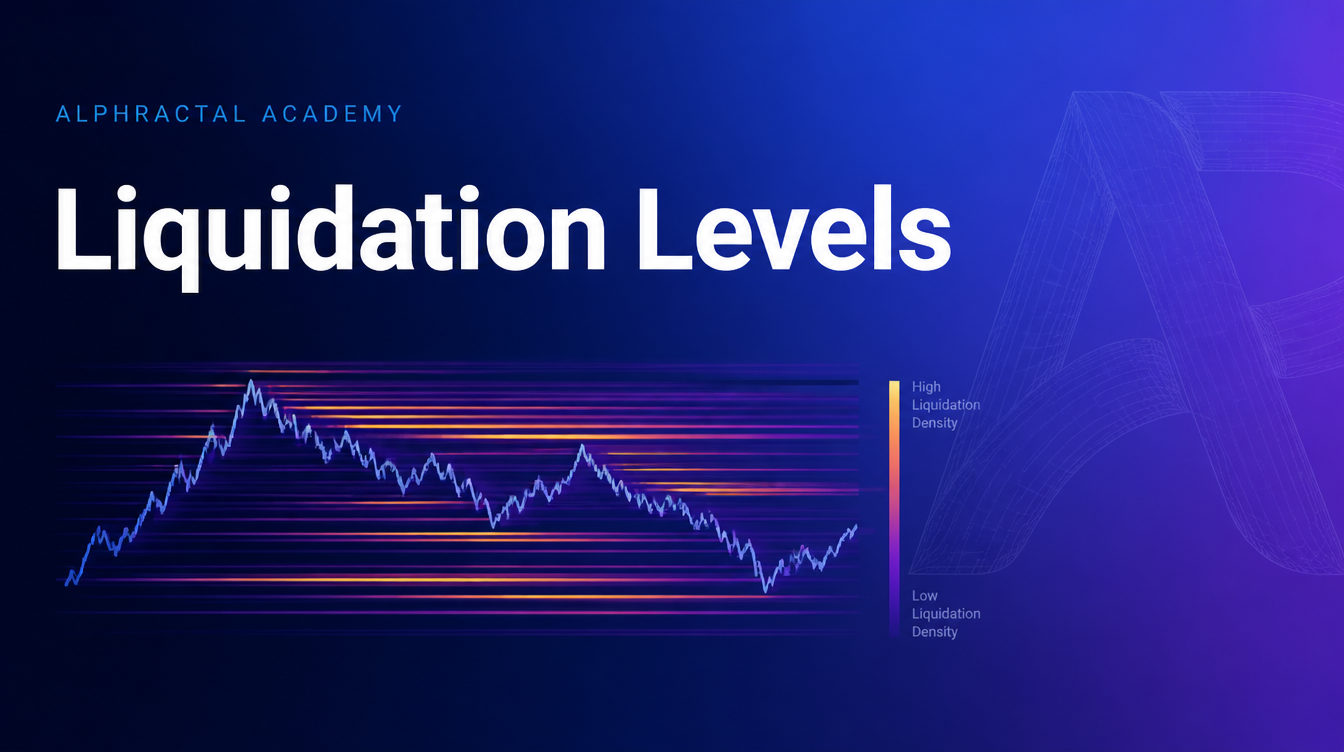
Liquidation Levels
The price zones where clusters of leveraged positions get force-closed — magnets for price and a map of where cascades can ignite.
7 minintermediate
Alphractal author
The price zones where clusters of leveraged positions get force-closed — magnets for price and a map of where cascades can ignite.

The total number of outstanding derivative contracts — read alongside price, it reveals whether a move is backed by fresh capital or just short covering.
A granular 0–100 sentiment scale across multiple timeframes (90/116/155/365/730d) — a leading pulse for shifts inside the broader Wyckoff cycle.
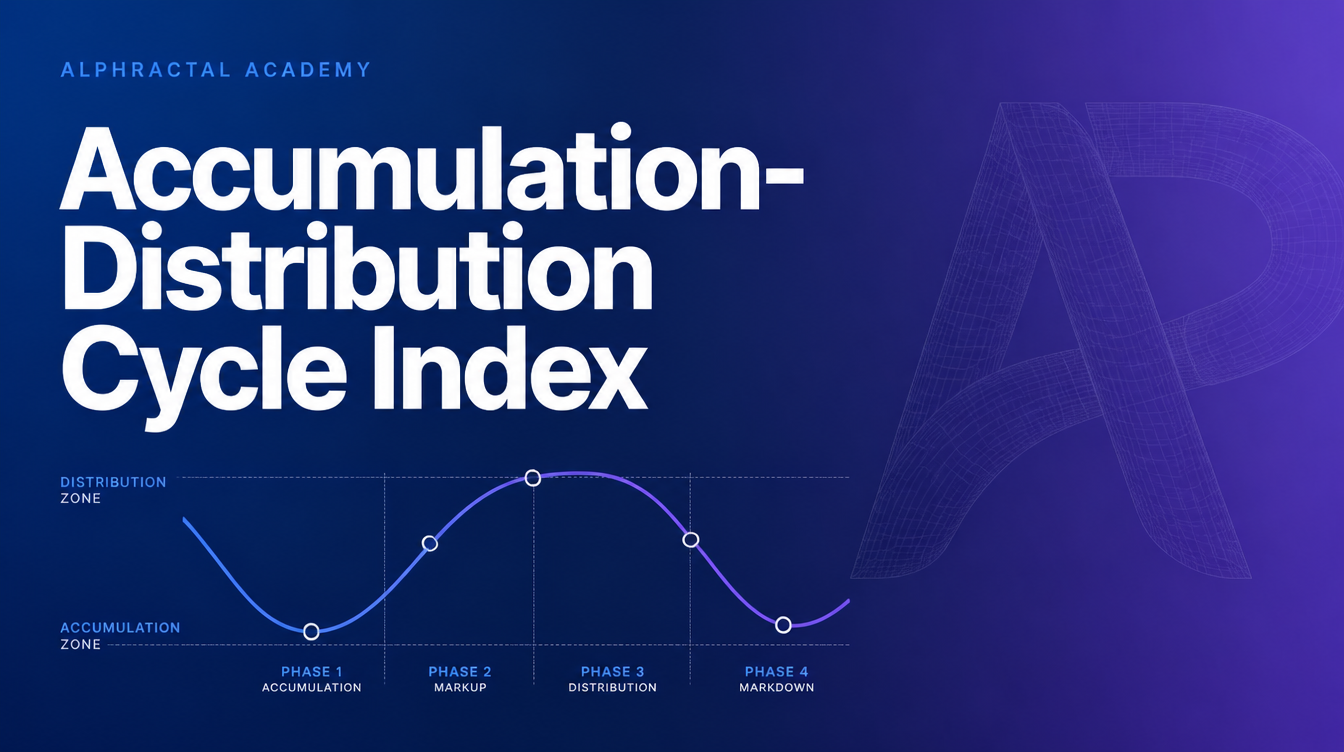
A Wyckoff-based, 0–100 on-chain index that identifies the macro cycle phase — accumulation, markup, distribution, markdown — from blockchain activity alone.
Weights coin movement by how long it sat still — surfaces the activity of long-term holders and smart money that raw volume hides.
The profit or loss realized when coins move on a UTXO chain — a real-time read on whether holders are taking gains or cutting losses.

From Graham to Genesis Block — a long-term valuation playbook that turns plain dollar-cost averaging into a fundamentals-driven process using three on-chain cost-basis metrics.

Your referral link, the 3-day welcome gift for friends, the 30-day reward for you, and the milestone system.

Profile, theme (dark/light), notification preferences (Alerts settings tab), and account security.
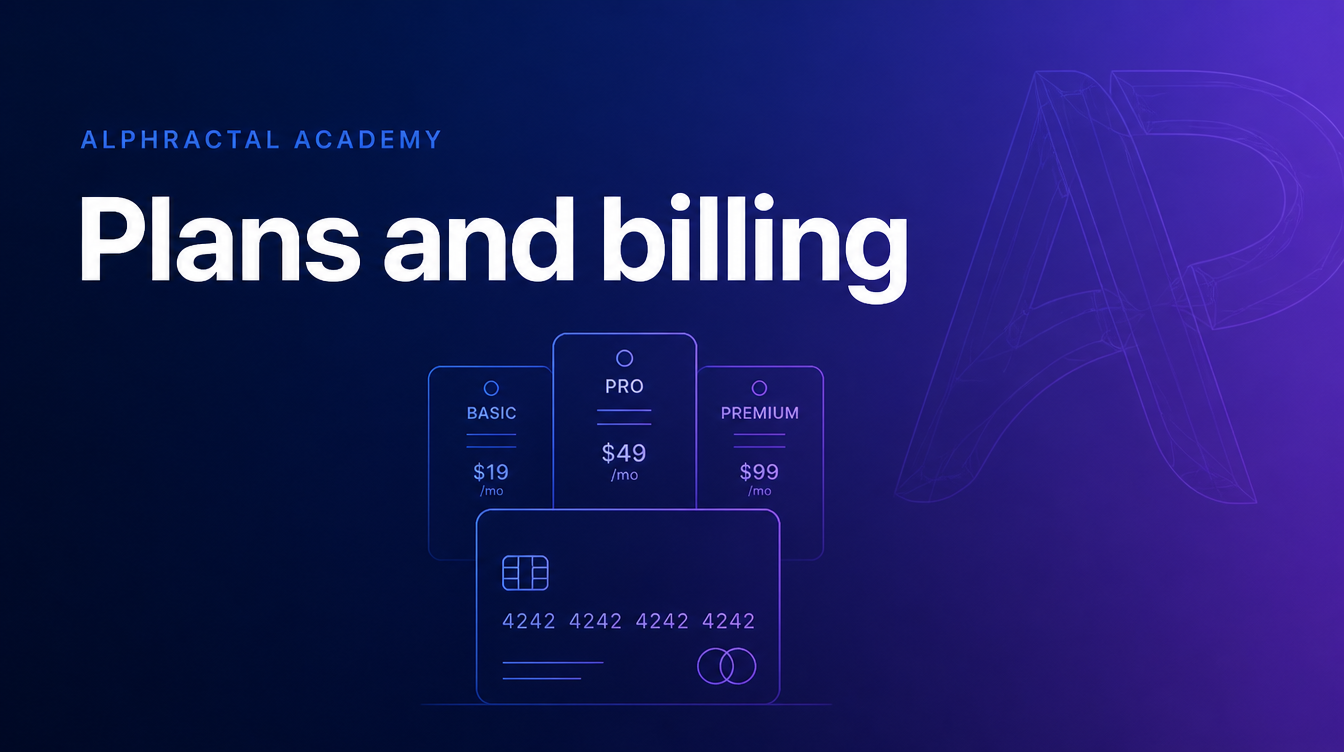
Starter, Pro, Max — what each tier unlocks, monthly vs annual pricing, and how upgrades + cancellations work.

API Dashboard tour, your default key, the credit system, and a first authenticated request — from zero to data in 5 minutes.
Hand-crafted custom charts (Liquidation Levels, CVDD, Pi Cycle, MVRV-Z, ADCI) and how the metric library is organised.
The /cryptos asset page — header, metric categories, summary panel, and the workflow analysts use to read a coin top-to-bottom.
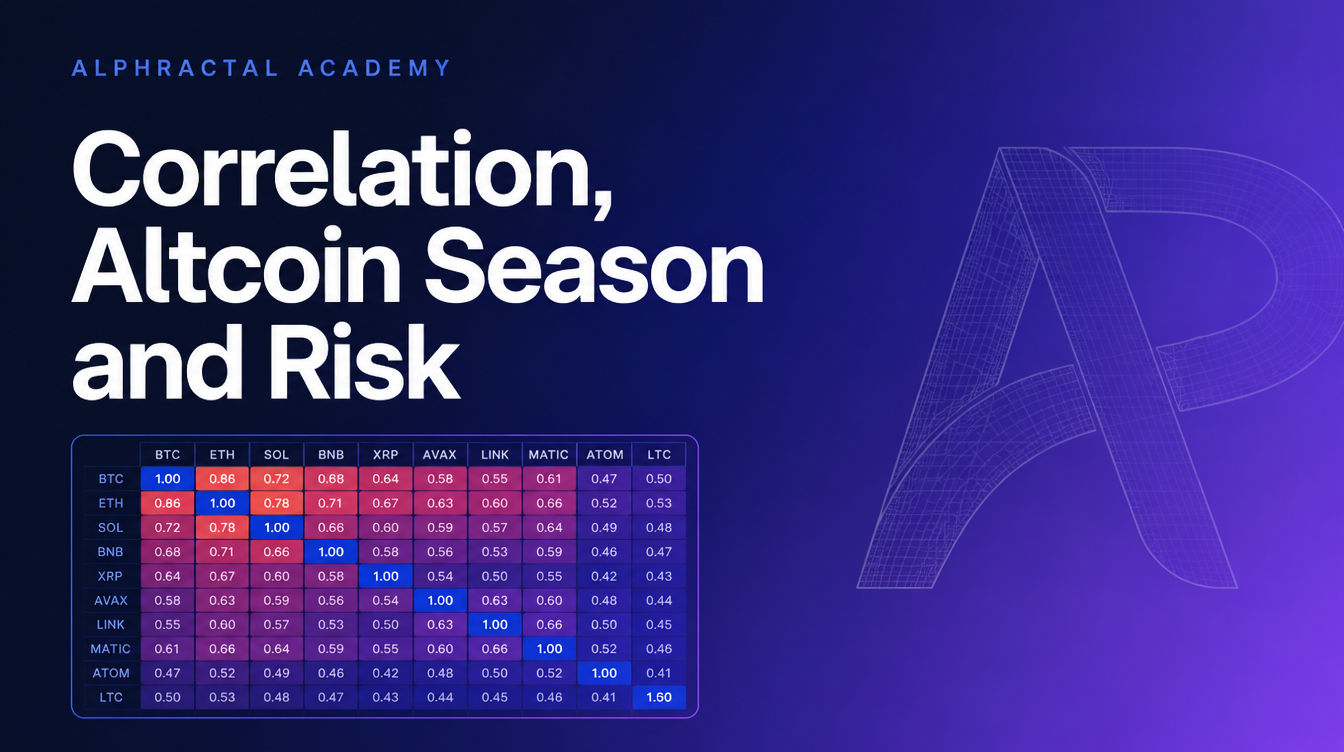
The three relational tabs — pairwise correlation heatmap, the Altcoin Season Index vs. Bitcoin, and the Sharpe-ratio-based Risk Analysis view.

Read the market by sector — Layer-1, AI, RWA, DeFi, Memes, Gaming — with strength, rotation, and sector-level alerts.
Alpha Quant, ATR-VWMA, PTO and other platform signals with backtesting, charts, and one-click alert creation per signal.
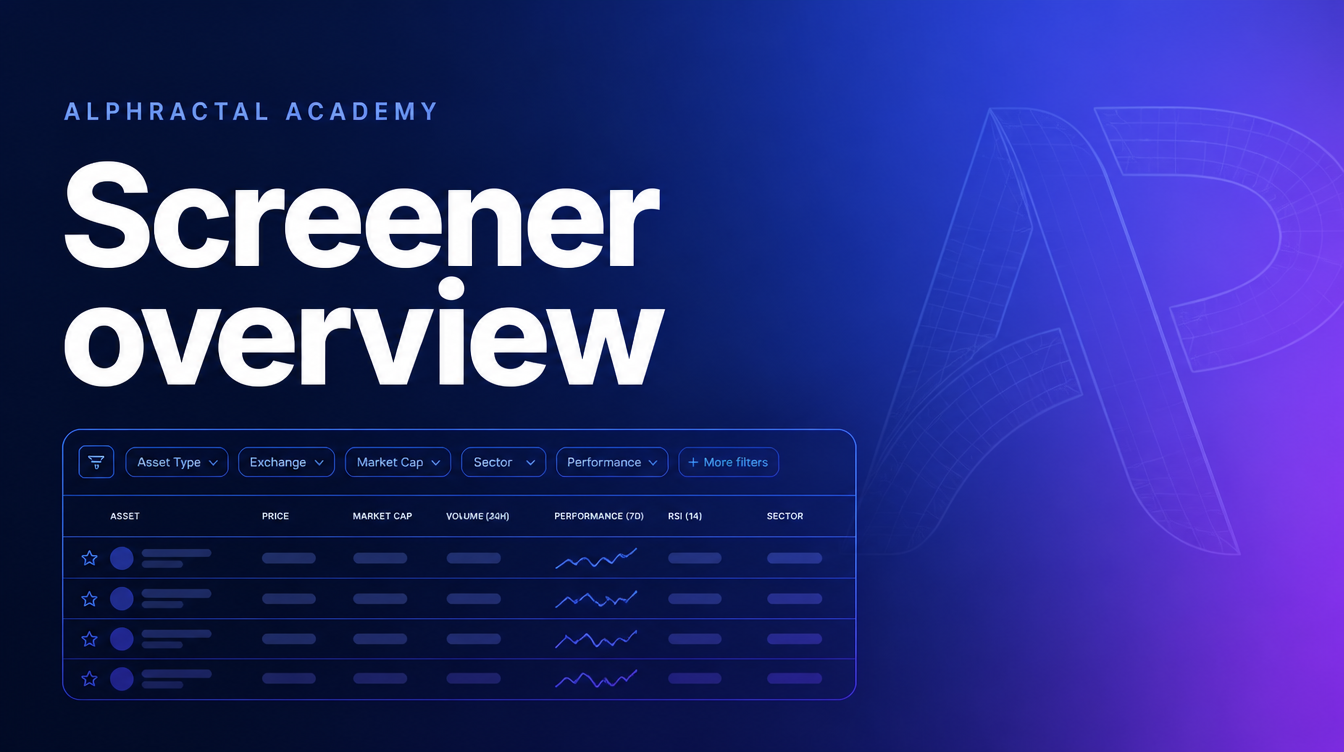
The 8 tabs, categorised columns, Smart Presets, custom Views, and how the unified asset header pulls everything together.
Layout presets (Markets & Macro, Risk-Off, custom), Edit mode for drag/resize, and saving your own preset.

How to interpret Recession Monitor, Yield Curve, Market Sentiment, Economic Stress Index, Global Indices, and the world map.
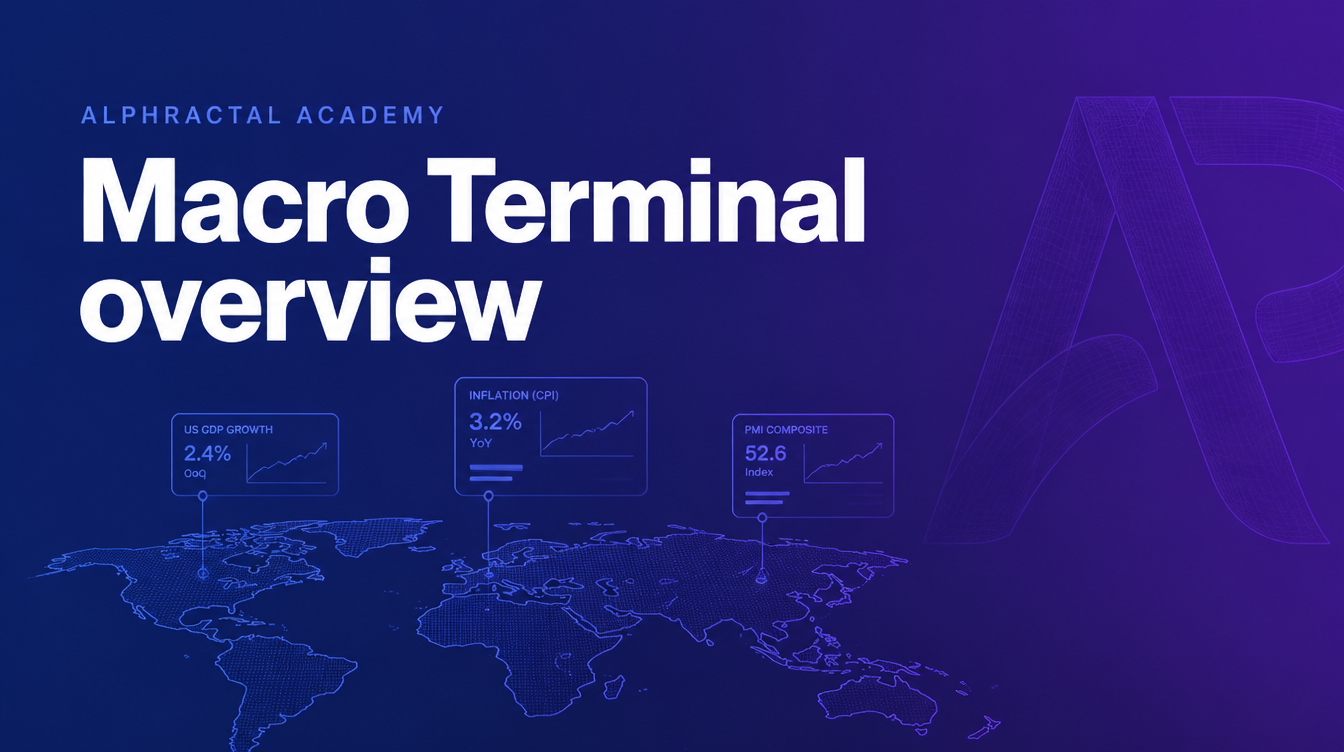
The 46+ panel workspace — Global Monitor world map, Market Sentiment, Recession Monitor, Indices, FX, Yield Curve, Economic Stress.

Send a dashboard to teammates via link or publish to the community marketplace.
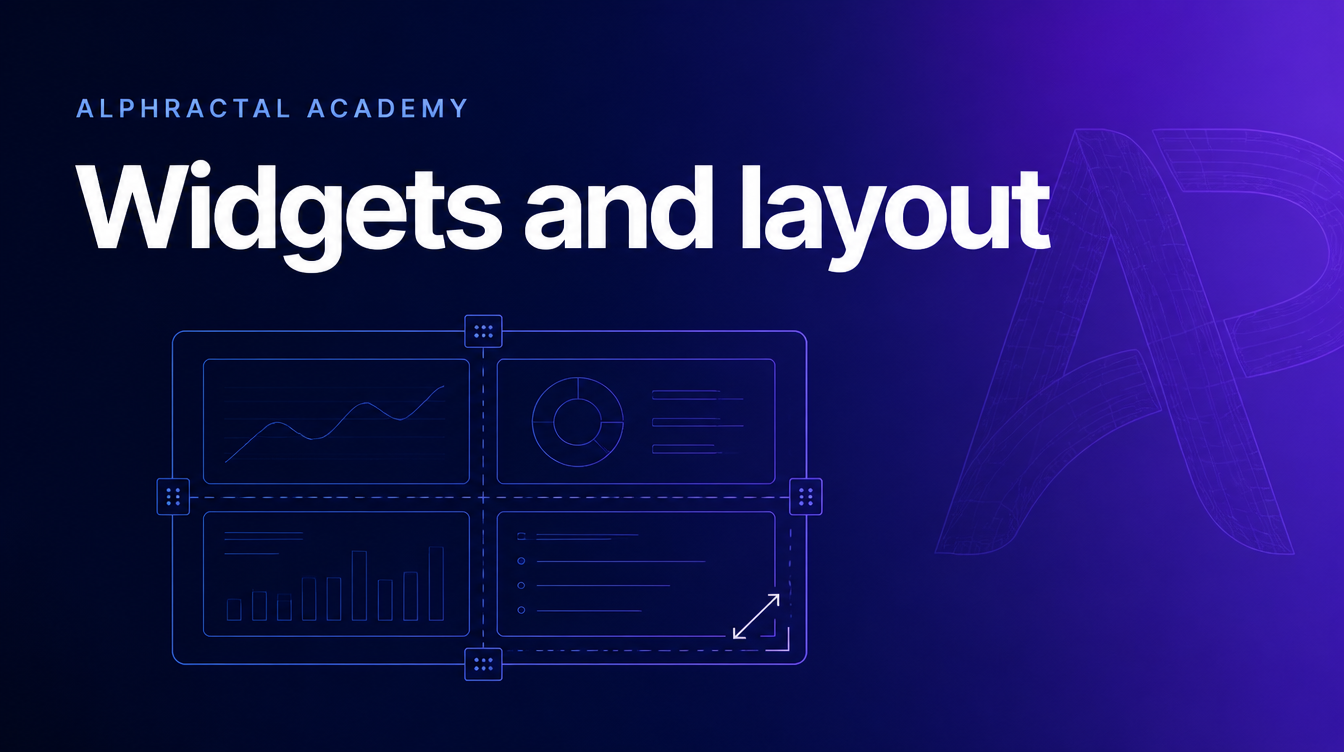
Add metric charts, custom charts, tables, and Market Pulse cards. Drag-and-drop, resize, and arrange the workspace.

Two creation paths — Marketplace (clone a community dashboard) or Blank (start from scratch).
Public Alerts (community curated), Alert Logs (every trigger), and how to inspect what fired and when.

Alerts at the sector level — Layer-1, AI, RWA, DeFi, Memes, Gaming — RSI/funding basics and advanced rotation presets.

Alerts that run against the whole Screener snapshot — fire when any coin enters or exits the setup.

Alerts on platform-native signals (Alpha Quant, ATR-VWMA, PTO, Buy/Sell Pressure, Risk, Altseason, Correlation).

The 3-step wizard end-to-end — category, asset, configure trigger conditions, delivery channels, and confirmation.

Prompt patterns that actually work — grounding by metric, asking for evidence, when to switch from Quick Ask to Deep Research.

A chat that reads the Screener tab you're on — your filters, visible coins, active signals — and answers in that context.

The chat dock inside every asset page — context-aware to the asset you're viewing, with signals built in.

When Quick Ask isn't enough — long-form, multi-step investigations grounded in the metric catalog.

What Alpha AI is, where it lives in the platform, and the basic ask → answer → suggested-chart loop.

The reader layout, the chapter list, voice narration controls (Press play to start), and how to use reports inside your own workflow.

The /research library — All / Reports / Alpha Insights / Academy tabs, the filter system, and what gets published weekly.

What's free in Starter, what unlocks in Pro, and when Max makes sense — including alert and dashboard limits.

Coverage tiers — BTC and ETH have everything, majors get nearly everything, long-tail assets get the basics. How to check what's available for an asset.
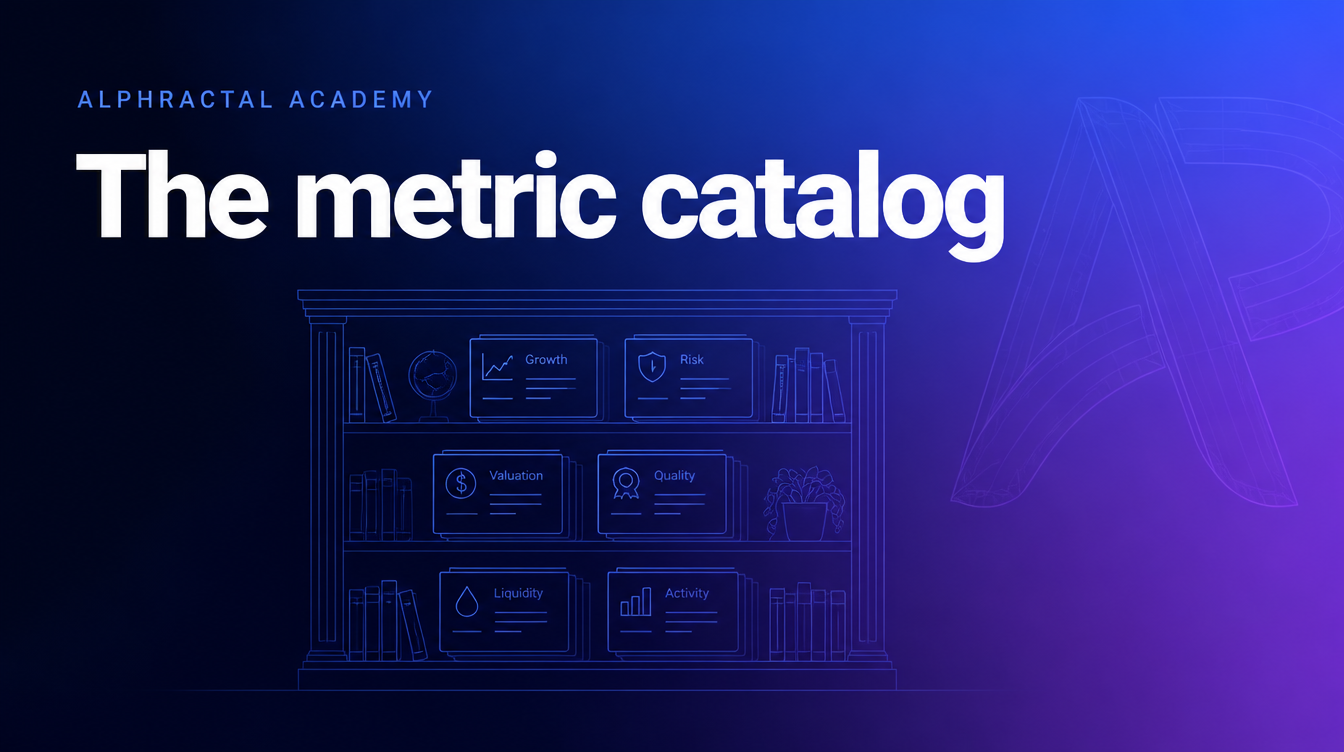
How the 1000+ metrics are organised — by category (On-Chain, Derivatives, Sentiment, Macro, DeFi) and by sub-category. How to find any metric in 5 seconds.

Open the asset modal, pick a coin, pin it to your watchlist, and follow it across the platform — the workflow every analyst uses.

Timestamps & resolutions, data availability windows, finalization (P vs F), the metric catalog, and the assets we cover.

Sidebar navigation, the ⌘K search palette, the global asset modal, and the Academy progress strip — the four things every new user should learn first.

What Alphractal is, the data we provide, and how the platform turns raw on-chain, derivatives, and macro data into decisions.
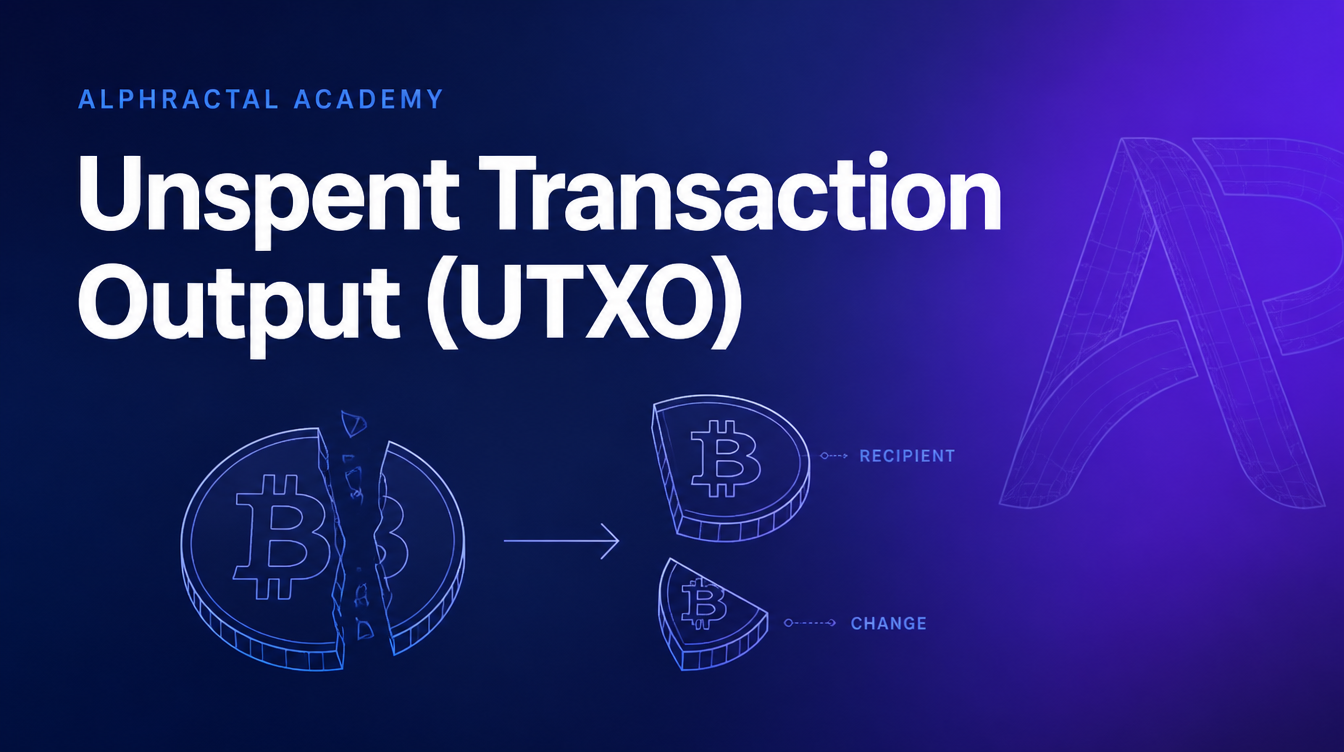
Bitcoin doesn't have account balances — it has timestamped, valued fragments. UTXO is the accounting model every on-chain metric (SOPR, CDD, CVDD, MVRV) is built on top of.
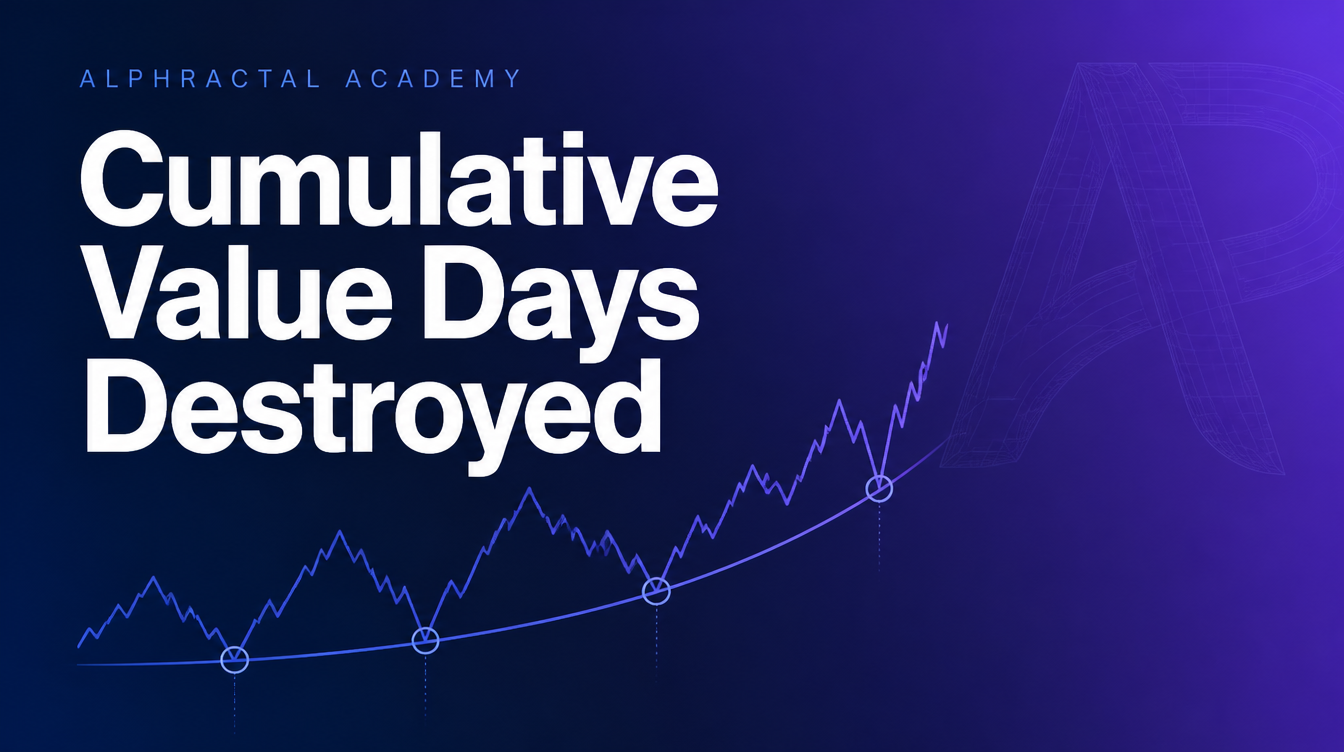
A pricing-floor model built on destroyed coin-value over the chain's entire history — it has marked every Bitcoin macro cycle bottom since 2013.
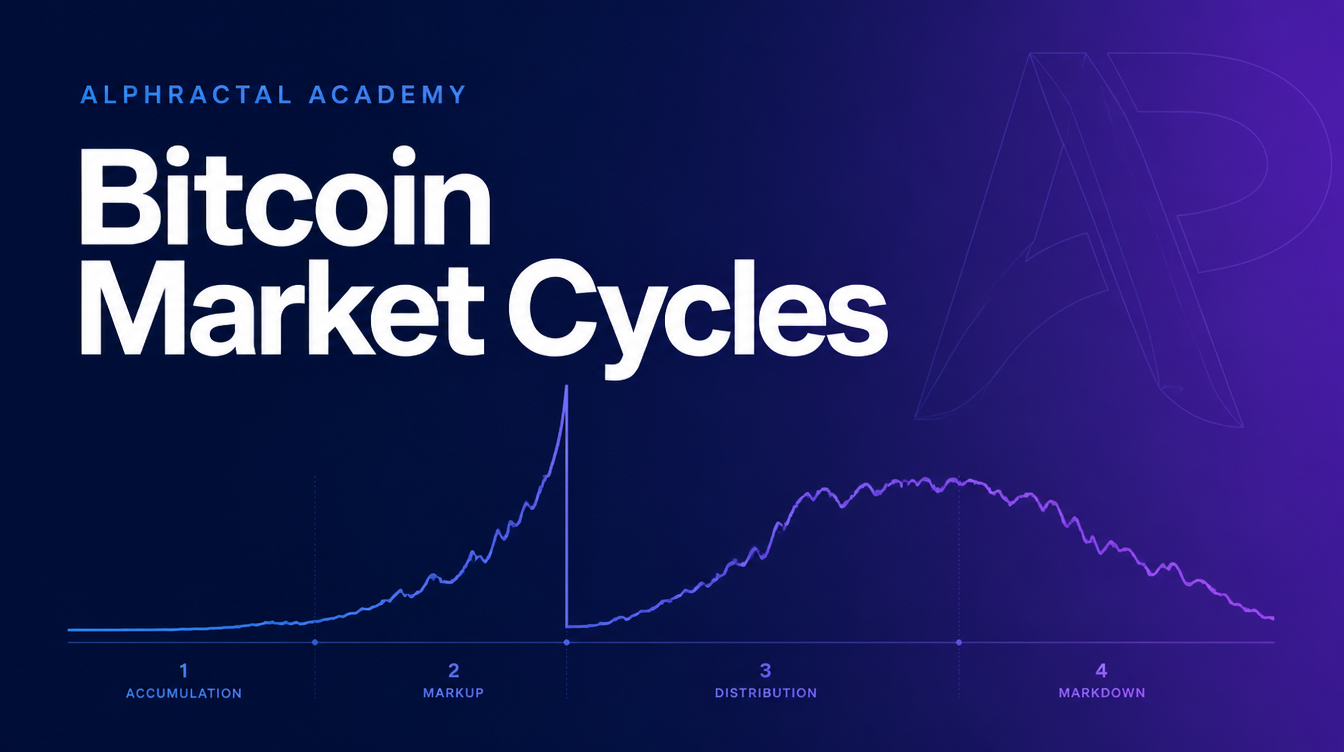
Expansion, top, contraction, bottom — and why a parabolic top is fragile while a lateral one is sustainable. The 4-phase cycle, the ~4-year halving rhythm, and the 5 on-chain metrics that locate you inside it.
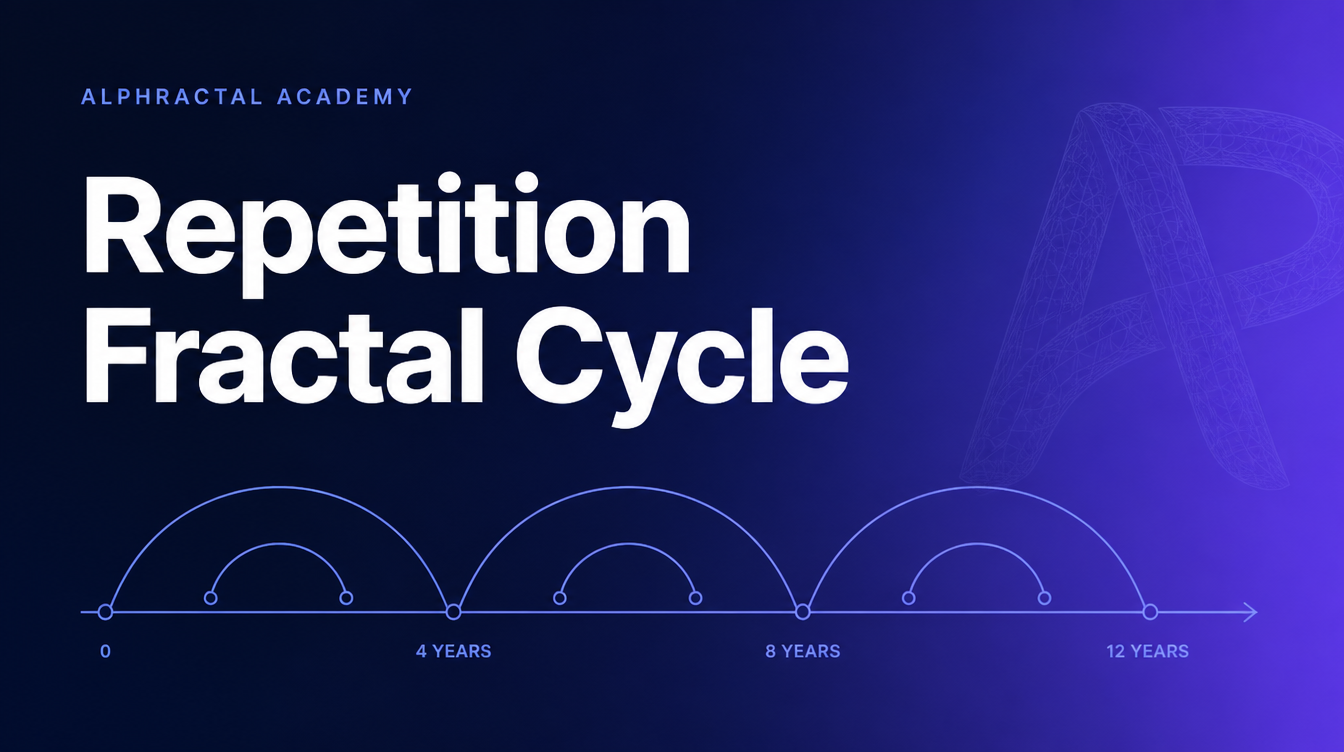
A proprietary timing model showing Bitcoin's ~4-year cycle repeats with mathematical precision since 2015 — Wyckoff nested inside Wyckoff across scales. Structural pattern recognition, made operational.
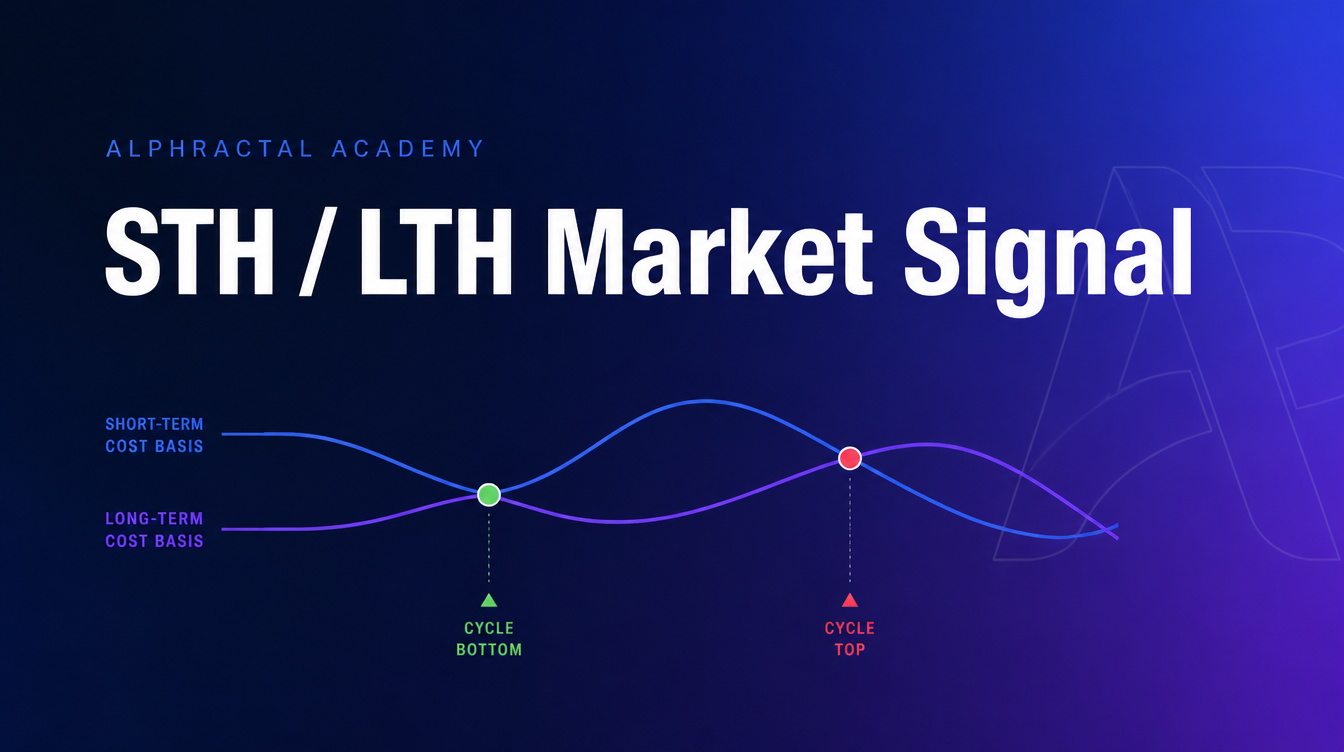
Short-term vs long-term holder cost basis. When STH Realized Price crosses LTH Realized Price, the system flags a definitive bear-market end or bull-market start — cost basis crossing cost basis.
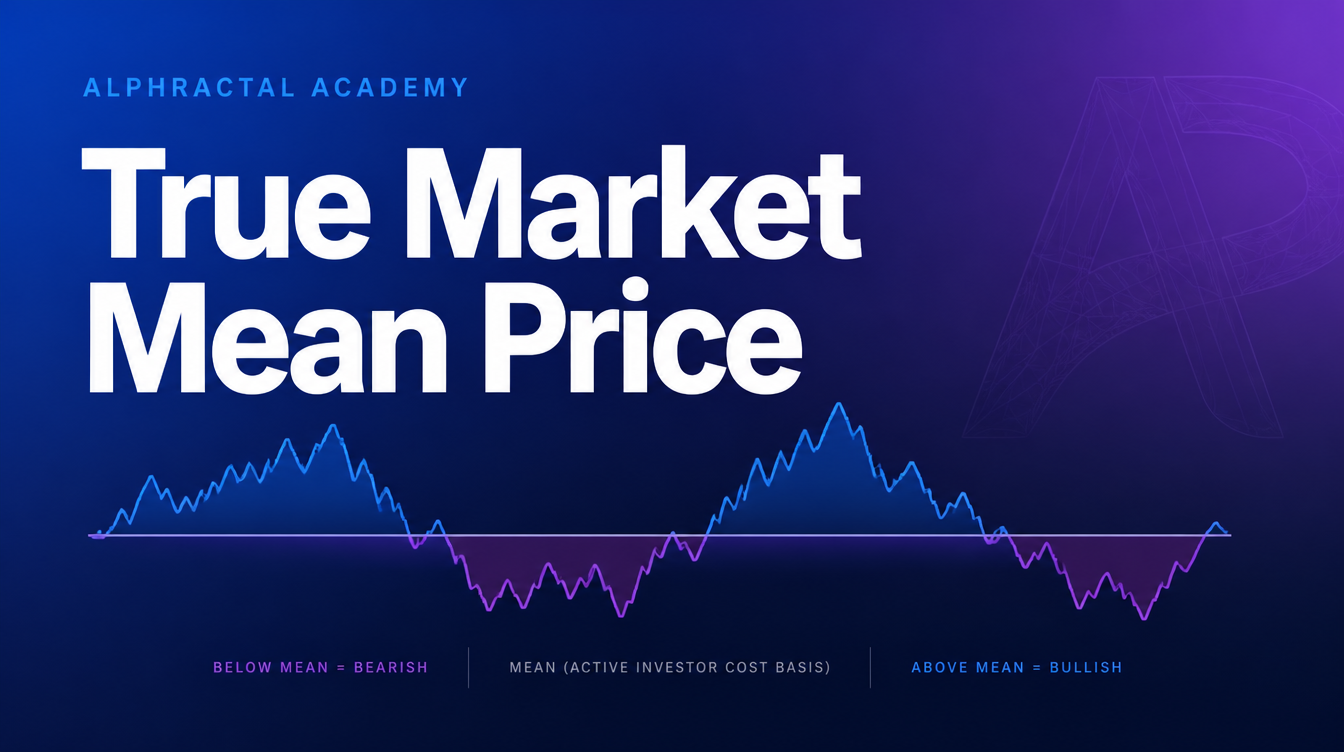
The average cost basis of actively-traded coins — Investor Cap ÷ Active Supply. Price above it = bull regime; below = bear. A cleaner trend reference than realized price.
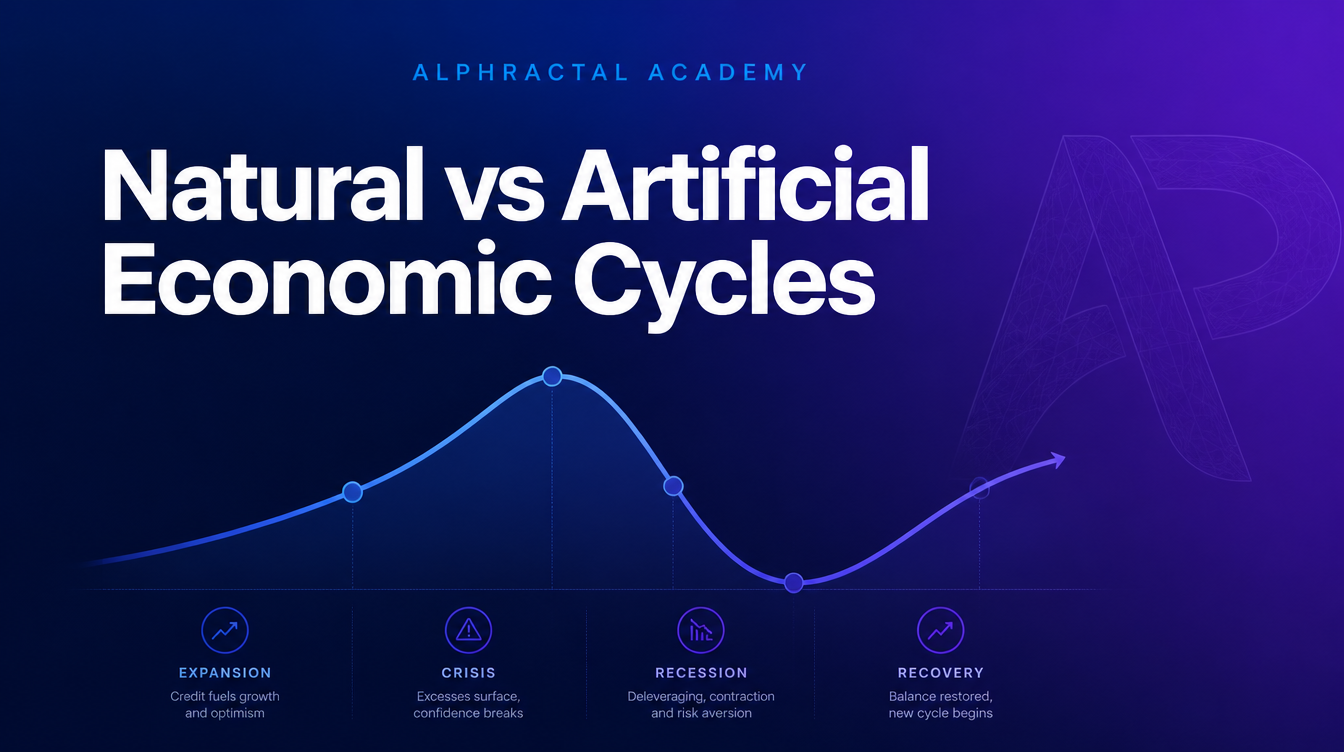
Not all cycles are the same. Natural cycles correct fast; credit-driven artificial cycles build hidden malinvestment that ends in deep recessions. The 4 phases, and the macro indicators that read them.